Old path or new path?
Silver investors are looking at the metal today and hoping that they will not be treated to a rerun of “That ’80s Show.” Most people remember that silver plunged, but…
Silver investors are looking at the metal today and hoping that they will not be treated to a rerun of “That ’80s Show.”
Most people remember that silver plunged, but the details in their minds might be fuzzy.
To lay the numbers out this morning I kept a doodle sheet on my desk Friday of the silver closes from the very top to Friday.
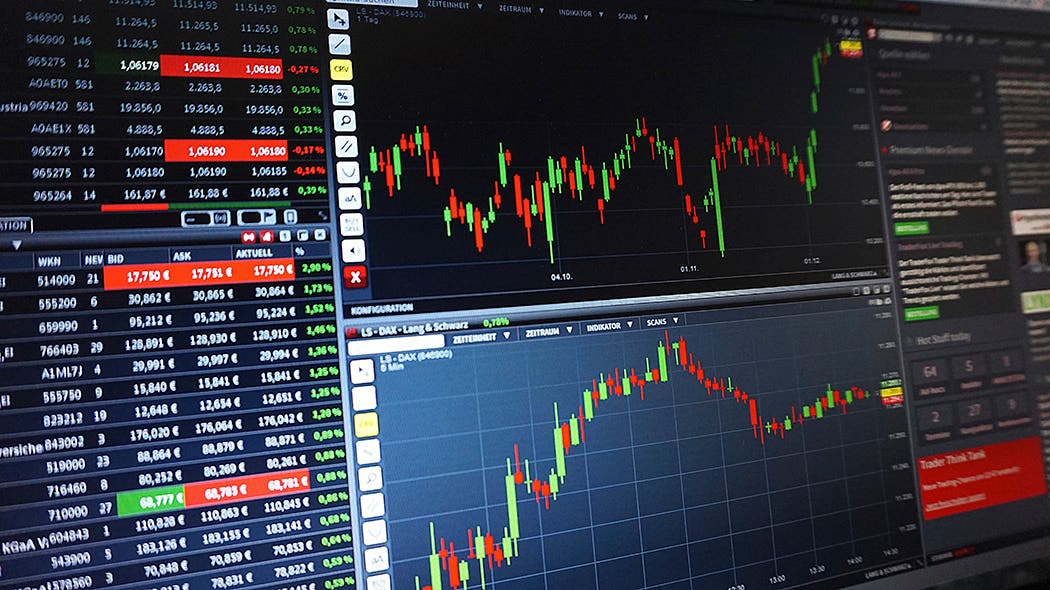
The "Wall Street Journal" had a similar idea because the front page of the Saturday edition put these numbers in graph form.
So here we go.
1980: $48.70 $46.80 $44.00 $34.00 $37.50 $36.50
2011: $48.58 $46.08 $42.58 $39.38 $36.23 $35.28
Eerily similar, aren’t they?
Stock investors were subjected to similar number series from the 1929 crash as the stock market approached its March 2009 low. That series looked eerily similar, too – until it didn’t.
What will happen with silver?
First, let’s see what happened in 1980. The next number is $33.50 in that sequence and then it began to recover, bouncing up to $33.95 and then $36.40.
Trading in 1980 remained within the range of $38.50 to $31 until the 36th business day after the high, then it started a second leg down that took it rapidly to $10.80 less than three weeks later.
The 36th day after this year’s high is June 21, if my count is correct – the first day of summer. July 11 would correspond to the bottom day of $10.80.
Will a second leg lower happen this time?
Silver investors will be hoping that the only fireworks in July will be the Fourth of July kind.
- Subscribe to the NumisMaster Coin Price Guide for access to the web’s most comprehensive list of coin values
- Join the NumisMaster VIP Program for free subscriptions, store discounts, and more!
- Buy and sell coins, currency, and more in our online classifieds