The numismatic hobby and gold investors might have been excited when gold passed the $1,200 milestone, but you would never guess it from mainstream media reports.
In fact, the precious metal is being trashed by mainstream media that claims it has not outpaced inflation; that it would have to go to more than $2,500 an ounce before it made up for its lack of traction over the years, and a host of other calumnies.
Numbers don’t lie, but the statistics that are being quoted are being manipulated to give gold, and by implication gold coins that follow bullion, as well as the highs and lows of the gold market, a bad or at least tarnished name. Except that one of gold’s virtues is that it doesn’t tarnish.
Two charts that I have prepared to accompany this article show the true color of gold and its value through the years. It uses the official price of gold from 1933 to 1968 (when such prices were official) and then the price quoted at year’s end on the New York Commodity Exchange, or if is that unavailable, the London afternoon fix.
The consumer price index is prepared by the Bureau of Labor Statistics, a government agency that has maintained the data since 1913. Every once and a while, when inflation takes a ravaging swat at the numbers, they readjust them – but mathematics has an easy way to make that equal. The labor bureau did that in the last half century three times: 1957-1958; 1967-1968 and 1982.
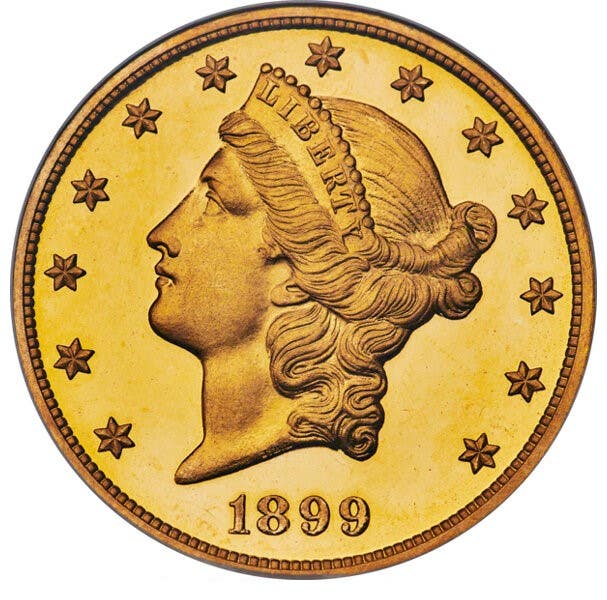
The base line start for gold is $20.67 an ounce, which gold was in 1932 and, for that matter, 1837. (It maintained that level, and supported it with coinage that was its full measure, from the administration of Andrew Jackson until that of Franklin Delano Roosevelt.) That’s right: the double eagle or $20 gold piece weighed 0.9675 troy ounces of gold which, when multiplied by the official gold price, is $19.998. In other words, the coin had full metallic value to support its face value.
The Bureau of Labor Statistics uses the stretch of years 1982-1984 to equal 100 as the basis for the CPI, meaning that mid 1983 is where 100 is reached; in 1913 it was 13.2 and today it is around 216.17. Thus from 1913 until today in 2009, a 96-year period of time, the CPI has increased about 16.3 times. The price of gold back then was $20.67 an ounce.
So to just keep up with inflation – no profit – gold would have to increase to $338.50 an ounce. Oh, it did that. But the first time bullion reached that level was in 1979. For gold to have been a good buy – double the rate of inflation from 1913 until now– it would have to top the CPI by 32.6 times (or $673.84 an ounce). It did that the first time in 1980.
Let’s look at a couple of different sets of numbers. In 1933, before FDR seized the nation’s gold supply, gold still was valued at $20.67 an ounce. The dollar was devalued the following year. After the government had paid holders of gold $20.67, FDR declared that an ounce of gold would henceforth be bought and sold at $35 and the CPI at that point in time was 14.20.
When gold entered free market status the first time and went to $43 an ounce, the CPI index number had pressure on it and rose to 33.20. On Jan. 16, 1970, the free market showed how free it was and gold dropped to $34.90 an ounce; the CPI was 38.80. When gold hit $1,200 an ounce, the CPI index number is at 216.
So measuring the CPI in 1934 (14.20) and running it to the present (216), gold would have to have increased from $35 to $532 an ounce to keep up with inflation. It has obviously done that – and much more.
I went to a Web site that saves time and effort, and probably money, by adjusting various prices for inflation. I used it to calculate how high gold had to go to reach some of the levels that have been quoted on the airwaves by pundits who can’t seem to add, subtract or multiply. Here are the results from www.westegg.com/inflation:
• From 1934 (gold $35) to today, gold would have to be at $557.18 an ounce to keep up with inflation.
• From 1970 (gold at $34.90), gold would have to be $192.01.
• From Dec. 31, 1974, when Americans regained the right to own gold, at $183.77 an ounce, gold would have to be at $727.55 just to stay even. It has more than done that, too.
So if you were a gold buyer other than at the very top of a market, odds are you’ve done well. (If you bought near the top of the market in 1980 at $800 an ounce, you have to wait for gold to reach $2,064 to be back in the money) and that is what the naysayers tend to focus on.
How long was gold at $800 or higher prior to the present uptrend?
From Friday, Jan. 17, 1980, until the opening of trading Tuesday, Jan. 22, 1980.
I think it is safe to assume that most current gold owners didn’t take their positions during those five days. Those who bought at $800 in the last couple of years are ahead of the game.
More Resources:
• State Quarters Deluxe Folder By Warmans