Gold wins 15-year asset race
Although the U.S. dollar has been one of the strongest assets over the past year, it doesn’t look quite so attractive if you look at a longer time frame. As…
Although the U.S. dollar has been one of the strongest assets over the past year, it doesn’t look quite so attractive if you look at a longer time frame.
As many of you know, I write a monthly newsletter titled Liberty’s Outlook for my company. In the issue written last Wednesday and just now being received by our customers and subscribers, I tracked how various major stock indices, currencies, precious metals and some generic blue chip numismatic coins have fared from Dec. 31, 1999, through Feb. 3, 2015.
A 15-year time frame is more in line with a long-term perspective. What happens with the value of an asset over the course of a day, a month, or even a whole year is not as important to most individuals as is long-term potential over a relevant time frame.
Any such analysis has limitations. First, I don’t have any useful statistics for real estate, so omitted that from my analysis. Second, a long-term analysis does not show significant recent shorter term trends that deserve consideration for future planning.
Third, the selection of any particular time frame can distort the analysis if you pick any market when it was at a temporary high or low point in its cycle. As an example of what I mean by this, a similar comparison to this that would have a starting date of Jan. 19, 1980, when gold and silver hit their all-time inflation adjusted peaks, would not show gold as favorably.
Fourth, although this analysis compares major stock market indices, that does not mean that each stock in a particular index or other stocks listed on the exchange performed at that level. In fact, almost all of them would have either outperformed or underperformed that overall index.
Fifth, what happened in the past is not a guarantee of how assets will perform in the future.
Last, the benchmarks to which the results are compared are themselves changing in value. What might look like positive results against one benchmark might not look so good versus another standard. For purposes of this analysis, I compared how the various assets performed over the time frame against the U.S. dollar and against one ounce of gold.
The articles I write for readers of this column are all original material. However, this analysis of how various assets have performed against the U.S. dollar and against gold is so interesting that Dave Harper agreed it was worth making an exception to share with a wider audience.
Here are the comparisons. The first number is the change in price of the specific asset as measured against the U.S. dollar and the second column is the change in price of the asset as measured against gold over the last 15 years. As you will notice, the price of all assets fell when measured against gold.
Gold +337.0% +0.0%
Silver +219.8% -26.8%
Platinum +190.4% -33.6%
Palladium +78.6% -59.1%
Numismatic Coins
MS-63 $20 St Gaudens +171.0% -38.0%
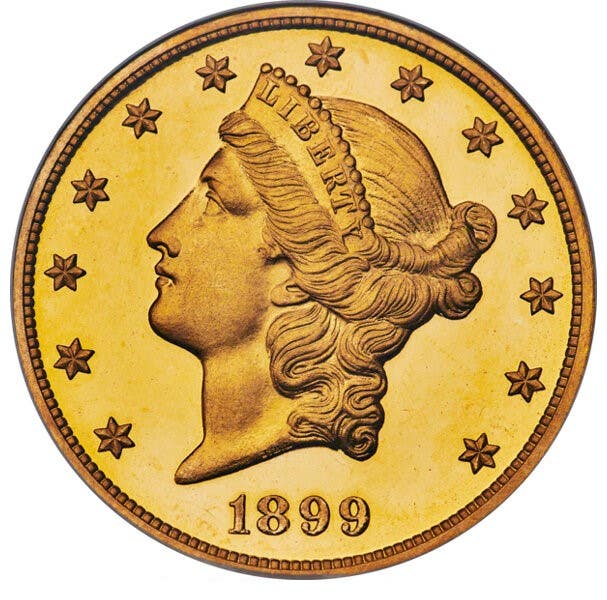
MS-63 $20 Liberty +161.0% -40.3%
MS-65 Early Morgan $1 +73.9% -60.2%
Stock Market Indices
Russell 2000 +137.2% -45.7%
Nikkei 225 +63.5% -62.6%
Frankfurt Xetra DAX +56.7% -64.1%
Dow Jones Average +53.7% -64.8%
S&P 500 +39.5% -68.1%
NASDAQ +16.2% -73.4%
London FT 100 -0.8% -77.3%
Fiat (Paper) Currencies
Switzerland Franc +72.4% -60.5%
New Zealand Dollar +40.6% -67.8%
China Yuan +32.2% -69.8%
Singapore Dollar +23.8% -71.7%
Australia Dollar +18.8% -72.8%
Canada Dollar +17.2% -73.2%
Thailand Baht +15.8% -73.5%
Peru New Sol +14.6% -73.8%
Euro +14.0% -73.9%
Malaysia Ringgit +6.2% -75.7%
South Korea Won +3.9% -76.2%
Hong Kong Dollar +0.3% -77.1%
U.S. Dollar +0.0% -77.2%
Taiwan Dollar -0.2% -77.2%
Great Britain Pound -6.1% -78.5%
Philippines Peso -8.5% -79.1%
Japan Yen -13.1% -80.1%
Chile Peso -15.8% -80.7%
Indonesia Rupiah -20.5% -81.8%
India Rupee -29.4% -83.8%
Brazil Real -32.9% -84.6%
Mexico Peso -35.4% -85.2%
South Africa Rand -45.9% -87.6%
The sources of information for this table include The Wall Street Journal, my own company’s closing spots for the U.S. markets (approximately the COMEX closes), and my company’s retail selling prices for the numismatic coins.
This table lists 37 assets. Of the 36 other than the U.S. dollar, 25 of them outperformed the U.S. dollar and 11 did not hold up as well as the American currency.
Out of all assets listed, an ounce of gold is far and away the top performer. Silver came in second best and platinum third. The MS-63 $20 Saint-Gaudens had the fourth best results, followed by the MS-63 $20 Liberty in fifth.
Coming in sixth to tenth best, in order, were the Russell 2000 Index, palladium, MS-65 early Morgan dollars, the Swiss franc and the Nikkei 225 Index.
Some surprising results include:
• The U.S. dollar fell 77.2% against an ounce of gold
• Against an ounce of gold, the Dow Jones Industrial Average plummeted 64.8%, the Standard & Poors 500 Index lost 68.1% and the NASDAQ dropped 73.4% – at a time when the media and general public are all abuzz about U.S. stock markets reaching so-called all-time highs!
• The Swiss franc outperformed by U.S. dollar by more than 72%
• For all the complaining by American politicians that the Chinese were suppressing the value of their currency in relation to the U.S. dollar, the yuan rose more than 32 percent against the dollar over the past 15 years
• Of the other 22 currencies analyzed, 12 of them outperformed the U.S. dollar
This past Saturday, I gave a presentation on the rise and fall of ancient Rome’s money and the parallels with America’s monetary history to the Polish American Numismatic Society in Troy, Mich. In answering questions after my speech, I referred to this table in the copies of the newsletter that I brought with me. Every single person in attendance made sure to pick up a copy.
I have also heard from people who received early copies of the newsletter, where the information in the above table became an immediate and controversial conversation subject. The politicians and bureaucrats in Washington, D.C. and officials at the Federal Reserve would probably hope that you don’t see this information, but informed citizens need to know.
Earlier, I wrote that past performance is no guarantee of future results. Even though gold and silver came out best in this analysis, they will not necessarily continue to do so. In my opinion, not only will they continue to stay in the top two spots over the next few years (with silver surpassing gold), the results will be even more impressive than listed in this table.
By the way, if anyone would like to view this 4-page issue of Liberty’s Outlook in its entirety, it will be posted soon at www.libertycoinservice.com. It might be easier to digest this way. Or you can send me an email at path@libertycoinservice.com to receive a .pdf file.
Patrick A. Heller was the American Numismatic Association 2012 Harry Forman Numismatic Dealer of the Year Award winner. He is the owner emeritus and communications officer of Liberty Coin Service in Lansing, Mich., and writes “Liberty’s Outlook,” a monthly newsletter on rare coins and precious metals subjects. Past newsletter issues can be viewed at http://www.libertycoinservice.com. Other commentaries are available at Coin Week (http://www.coinweek.com and http://www.coininfo.com). He also writes a bi-monthly column on collectibles for “The Greater Lansing Business Monthly” (http://www.lansingbusinessmonthly.com/articles/department-columns). His Numismatic Literary Guild award-winning radio show “Things You ‘Know’ That Just Aren’t So, And Important News You Need To Know” can be heard at 8:45 a.m. Wednesday and Friday mornings on 1320-AM WILS in Lansing (which streams live and becomes part of the audio and text archives posted at http://www.1320wils.com).

