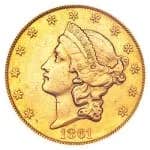
Gold, silver on merry run since ’70
Uncharted territory and economic uncertainty seem to be the driving force behind gold’s surge to the $1,600-an-ounce mark in recent days. The by-product of this is that silver has also moved to more than $40 an ounce, even as platinum and palladium have not moved substantially.
Uncharted territory and economic uncertainty seem to be the driving force behind gold’s surge to the $1,600-an-ounce mark in recent days. The by-product of this is that silver has also moved to more than $40 an ounce, even as platinum and palladium have not moved substantially. To close out a week of trading as this was written, platinum was down a dollar to $1,761 and palladium up $7 to $781.
Momentum has shifted and buyers seem to have remembered that as the U.S. Congress and President Barack Obama dance a minuet on an overhang of the cliff of default, which one way or another should be settled by the time this issue reaches readers. Precious metals remain an asset of last resort that this time just might come into play – or not. That has always been the tease during the monetary upheavals of the last four decades.
Looking back at history, it is instructive to consider the year 1970 (when gold actually fell briefly below the old official price of $35 an ounce) and contrast what has happened in the succeeding 41 years. Here’s the starting point in that analysis:
Gold was $37. Silver was $2. Though not part of the graph, you might be interested to know that back then platinum was $121 and palladium was $34.
Numerically, it seems more impressive that gold has jumped from $37 an ounce to just about $1,600, and indeed, the 40-year rate of compounded return is a tad over 19 percent annually. And indeed, silver’s rise from $2 an ounce in 1970 to over $39 an ounce on July 15 has a respectable rate of return over nearly 8 percent annually.
But the change from the year 2000 until today (essentially a 10-year period) tells a different tale. Gold was about $274 an ounce then (silver was $5), and the price rise gives a 10-year compounded return of 19.26 percent for gold and a whopping 22.89 percent for silver.
The performance of the different metals is very much in evidence in the last six months. On Jan. 4 of this year, gold opened at $1405 and closed the day at $1,388 (giving gold a 14.9 percent increase to July 15 (gold at $1,595.10). Silver by contrast started at $30.67 going to $39.27, a 28.04 percent gain in about six months.
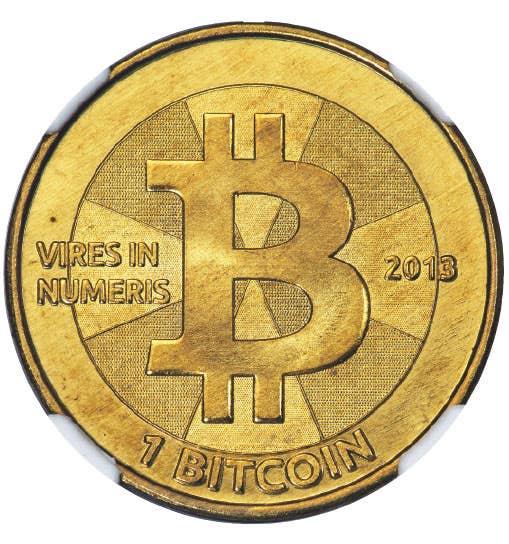
Perhaps next year I will be charting palladium as investors will get the chance to buy it more conveniently. A U.S. palladium bullion coin is in the works, now awaiting the results of a marketing study that the Mint is undertaking at the direction of Congress.
More Coin Collecting Resources:
• Subscribe to our Coin Price Guide, buy Coin Books & Coin Folders and join the NumisMaster VIP Program