Gold losses unfold on schedule
Though I do not have a crystal ball, with today’s carnage in the precious metal markets I feel like whatever I was looking at May 1 was the next best…
Though I do not have a crystal ball, with today’s carnage in the precious metal markets I feel like whatever I was looking at May 1 was the next best thing.
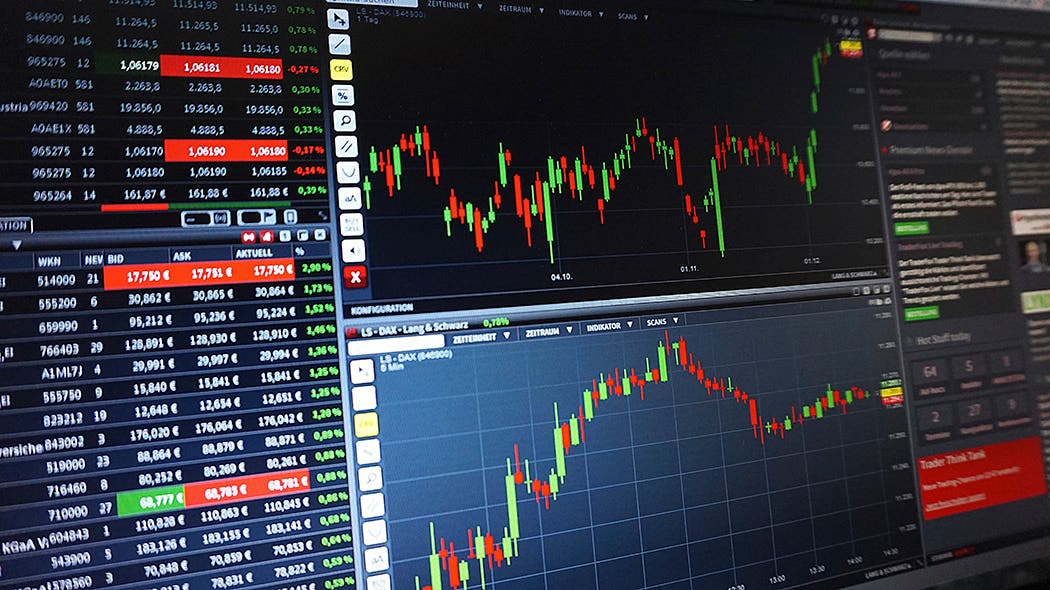
Gold has been pummeled below $1,300, according to the Kitco website this morning, taking the metal to a level not seen in two and a half years.
Similarly, silver has plunged to just over $20 a troy ounce _ just one cent over at that.
Anyone who took my May 1 blog seriously will not be surprised.
Because of the two-day drop in the price of gold in the middle of April and the price action in the days immediately following, I decided to compare the pattern with what unfolded after the great 1980 high point.
I counted the number of days for various price levels and it became obvious that gold would drop in the pattern stayed the same.
The critical dates were May 10, May 31 and June 19.
Gold duly dropped on May 10 and May 31 right on schedule.
Today’s action seems to indicate that the June 19 date was one day off. Gold actually closed a bit higher yesterday, but that is no consolation this morning.
Also, where the June 19 date was supposed to be a bottom as a bounce set in the 1980 pattern, that might give some hope for the metal either later today or tomorrow.
We’ll see.
I will have to go back to the 1980 records to see what comes next.
That 1980 trading pattern seems to have some relevance to the state of things this year. Why this might be so I do not know. I am not an expert on trading cycles.
There is great skepticism now that gold and silver are truly in downtrends. That was also strongly true in 1980.
Buzz blogger Dave Harper is editor of the weekly newspaper "Numismatic News."
- Subscribe to the NumisMaster Coin Price Guide for access to the web’s most comprehensive list of coin values
- Join the NumisMaster VIP Program for free subscriptions, store discounts, and more!
- Buy and sell coins, currency, and more in our online classifieds