Gold bullion or gold coins bring balance
For hundreds of years, gold has been an asset of last resort. That means that in times of desperation, it has made the difference, for some, between life and death. It has outpaced inflation, frequently outstripped other investment vehicles, yet at other times has been a stick in the mud going nowhere.
For hundreds of years, gold has been an asset of last resort. That means that in times of desperation, it has made the difference, for some, between life and death. It has outpaced inflation, frequently outstripped other investment vehicles, yet at other times has been a stick in the mud going nowhere.
From 1837 to 1933, for example, with some narrow wartime exceptions, gold had a fixed and guaranteed international value of $20.67 an ounce. That broke down in Franklin Roosevelt?s administration when the dollar was devalued by about 60 percent and gold?s price raised to $35 an ounce.
That guaranteed rate was forcibly retained until the late 1960s when gold was set free from a fixed dollar rate in a floating market, and later, in August 1971, the dollar was again devalued and gold?s price raised to $38 an ounce. A subsequent devaluation to $42.22 an ounce for gold ? still the official rate ? followed in the Nixon administration.
Even today, with gold nearing $700 an ounce, official U.S. gold reserves are valued at $42.22 while the market price of gold is about 16.5 times higher. (That means that as of March 31, 2007, the Federal Reserve and the Treasury have 261,498,899.316 ounces of gold with a ?book? value of $11,040,483,529.10 but a realistic vault worth $182 billion.
For all the talk of American economic collapse internationally, the U.S. gold reserve still far outstrips everyone else?s. The $182 billion outstrips official gold holdings of many other nations (see accompanying table of gold holdings by nation). The tonnage is calculated at the rate of one metric ton (1,000 kilograms) = 32,150.7 troy ounces.
The price of gold has been less than stable since it was uncoupled from the dollar in 1968, but it has had a stability ? if upward mobility ? perhaps in part because when you add the top 20 holders of gold excluding the International Monetary Fund itself, the United States has about a third of the world?s gold (261.5 million ounces, or 8,133 tons). The IMF has 3,217 tons or a little bit over 100 million ounces of the metal.
From 1980 to the present, the price of gold has several different periods, but a trading range of $300-$450 an ounce is a dominant feature. It comes off a 1980 high of $800 an ounce, an average (for the year) of $613 an ounce and then the ups and downs associated with a commodity, not an asset of last resort.
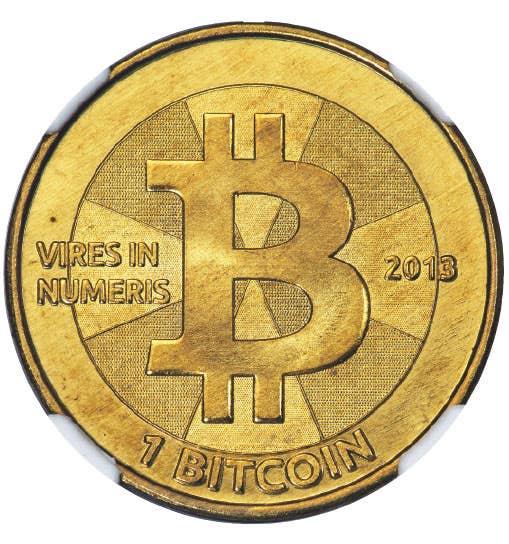
With this as background, a reader inquired recently whether I thought it better to acquire gold as bullion, Krugerrands, American Eagles or U.S. numismatic gold coinage. A prior column dealt with the issue of how and why you make these choices (I chose the Eagle), but the unanswered question is what performs better: numismatic coinage or gold bullion.
I undertook an analysis ? not scientific, but rather random ? using several different coins designed to mimic a numismatic coin with more bullion content than numismatic worth. That meant condition ran from about uncirculated to MS-63 but most were plain old MS-60.
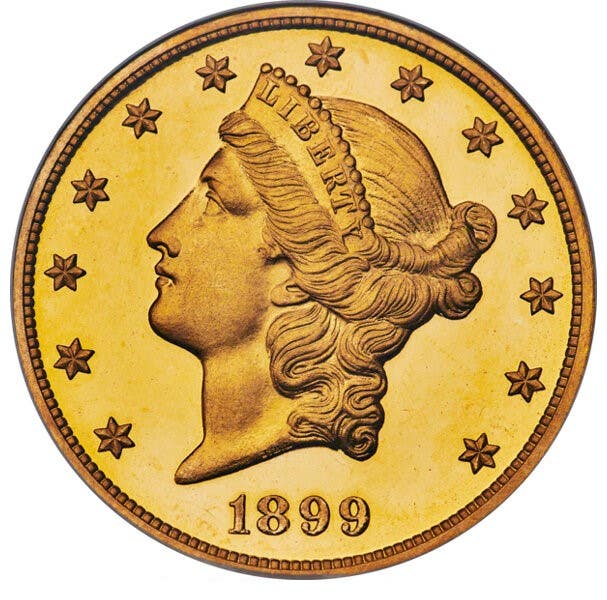
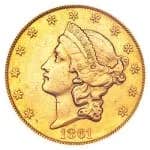
The coins included an 1850-O gold dollar, an 1880-CC $5, a 1932 $10 in MS-60, an 1880-S in MS-63, an 1890 quarter eagle in MS-60, a 1925-D $2.50 in MS-60 and three double eagles, an 1889 in MS-60, a 1909-D in AU-50 and a 1916-S in MS-60.
An accompanying graph shows bullion?s average price from 1980-2007 (it?s the lowest line on the other charts, consistently). Then compare trend lines of the double eagles. There is no comparison. The small numismatic premium yields greater rewards.
While the floor is the bullion, the numismatic differential gives a greater rate of return that is immediately visible on the graph. There are certainly other ups and downs and bumps on the coin prices, even the about uncirculated 1909-D double eagle doesn?t follow the bullion price, but instead charts its own course.
For those interested, I charted gold bullion, the Dow Jones Industrial Average, a 1921 MS-63 Walking Liberty Half dollar, an 1850-O $1 MS?60 gold coin and an 1880-CC half eagle in AU. The Dow?s recent gains nearing 13,000 give the visual feel of a hard train for other investment vehicles to catch at this time ? but the coin results are far from shabby.
What the numbers make clear is that those who thought gold?s role in the monetary system or even governing collectibles was dead and buried need to re-think their position. A new era for gold may have begun.